In general all is well, but I ran into problem when signal is framed, i.e. arrives in pieces, shorter than the actual DSC message (~9 s). Surely, PCs are powerful and have a lot of RAM these days and by detecting the start I could simply cache enough samples for full one message processing, but, well, I would like to make it work even with joined signals.
So the problem is, that if I process signal e.g. in 1 s frames, my instanteneous frequency does not join nicely. I tried to add a 0.1 s or 0.2 s overlap, but to no avail, I get false center frequency crossings.
Would you have any suggestion, how to join instant frequency response?
I currently do first Hilbert transform, then instantaneous phase and instanteneous frequency for all received frame. I also apply Butterworth filter on final “reconstructed” signal, but it jumps up and down where two frames meet. I.e. the start of the signal is sketchy. And even overlap with previous frame does not alleviate the issue. Maybe there is a better method of tracking instant frequency on such a running signal, doing it maybe just one-by-one sample?
]]>Another question is say I want to provide a .wav file and not take input like the one shown, what changes do I need to make? ]]>
No problem. Thanks for the comment.
]]>On my data, sliding window measurement (1 min time bin) of ‘instantaneous phases’ of brain voxel waves will yield, for example 84, phases for a bin,and the next bin will yield another 84 phases, and so on, to the last 280th time bin. Now, I need to confirm that the last phase (radian) of the previous time bin be equal to the first phase of the next time bin. As ‘unwrap’ was used to get ‘inst_phase = unwrap(angle(z)’ stiching phases of each seqential bin is OK without any touch such as shift?
p.s. While mouse roaming, inadvertantly rating was done and system does not allow me to change my rating even I once out and in again with this message “You Had Already Rated This Post. Post ID #14208.” Sorry for under-rating as rating should have been 5.00 from my side.
]]>Thank you for letting me know. The formula display issue is corrected now.
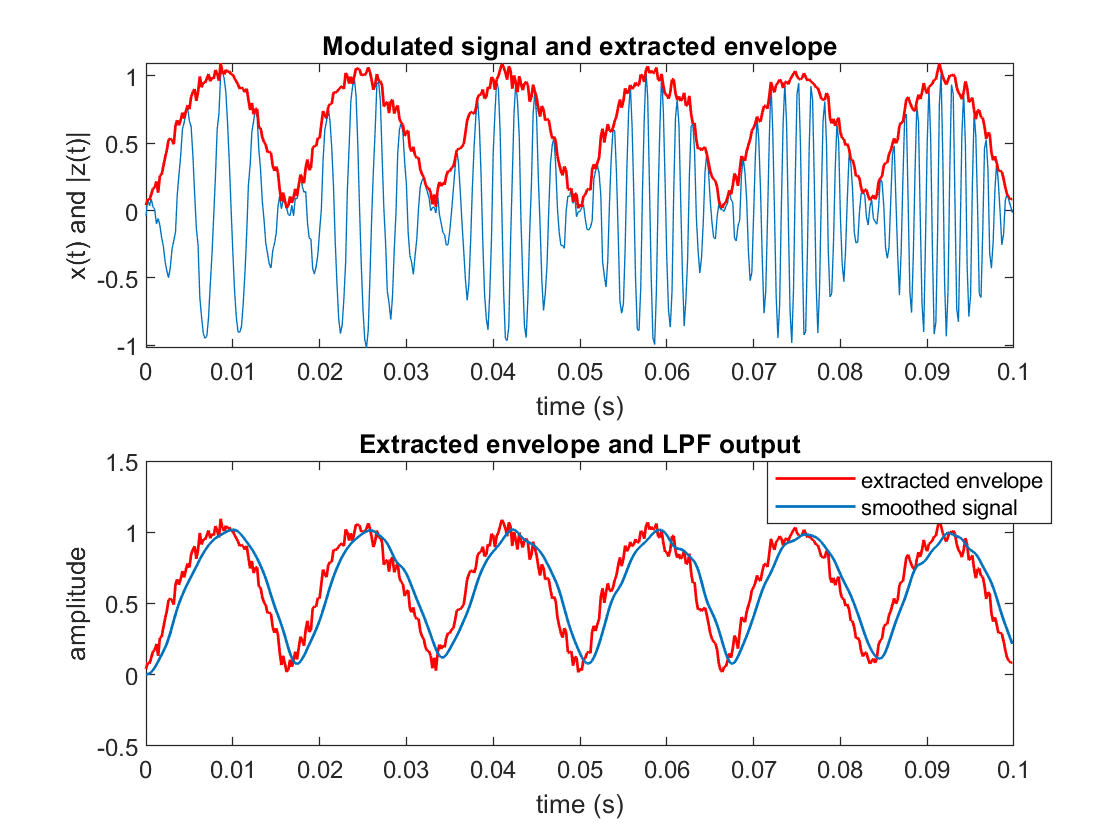
]]>The extracted envelope can be smoothed by passing it through a low pass filter (LPF).
Use Matlab’s firpm function or Python Scipy’s remez function to design the LPF.
In the following example, I have added noise to the modulated signal and hence the extracted envelope is noisy. The noisy extracted envelope is passed through a LPF to obtain the smoothed signal.
Hilbert transform has wide range of applications. Two of them are listed here
Electrocardiography: The Hilbert transform is a widely used tool in interpreting electrocardiograms (ECGs).
The Hilbert-Huang transform: In time series analysis the Fourier transform is the dominating tool. However, this method is not good enough for nonstationary or nonlinear data. For this purpose, the Hilbert-Huang transform (HHT) was proposed. This method has gained popularity and is widely used in spectral analysis since it, in contrast to common ”Fourier methods”, suppose that frequency and amplitude of the harmonics are dependent on time. This is achieved by decomposing the time series into so called intrinsic mode functions (IMFs). However, in spite of considerable efforts, the HHT to this day lacks mathematical framework and the method is entirely empirical. Thus, the investigation of this method is carried out numerically in this thesis to try to understand how the method works and what limitations are inherit.
]]>